Ranking of best Basketball & Football TEams
All-time Rankings of Universities Playing both Div. I Sports
“There are three kinds of lies: lies, damned lies, and statistics”
In his musings, Mark Twain quoted Benjamin Disraeli’s comments about stats. How you feel about them depends in part on what side of the stat line you stand with your team. The tweet from the NCAA @marchmadness account on 8/1 caused a bit of a stir among football fans. Many programs looked at the…well, let’s admit it…typically click-baity post with astonishment. “This list sucks. Where is [insert my school here]?” I asked the same question but wanted to find a non-homer answer..
I discovered that the post was based on a methodological mess. While it’s not a lie, the tweet represents an all too lazy reliance on pre-packaged stats. The author of the story linked to the tweet claims the results are based on simple win percentage by schools appearing on the historical leaderboard for both sports. Not so. It was based on incomplete lists, one of which included a lot of folks sitting in someone else’s seat. The lists of win percentages yield rankings that, in turn, may be added together to present a fair generalization of combined success…if done right. Here’s where things got sloppy.
Problem #1: Leaderboards include all competitors. The NCAA tweet limited contenders to the NCAA’s “Top 50” lists of all-time winningest schools, ignoring 80 football schools and a whopping 301 basketball schools that might have enjoyed a shot at the title. To be fair though, if you’re not in the top 50 of one or both lists, your chances are slim to make the combined Top 16.
Problem #2: One-third of the schools on the all-time basketball list used in the NCAA tweet don’t even play Division I football. To determine combined basketball and football success at the DI level, the author should have removed the remove the clutter. By including schools that don’t qualify for this particular competition, several teams were left standing on the sidelines scratching their heads.
Here’s what that tweet really described:

how to fix it?
Well, I opened up the record books available on the NCAA website (click to find PDFs for basketball and football) and crunched the numbers. Since the original NCAA tweet claimed to show a compilation of top teams competing in Division I in both sports, I skipped the “Top 50” lists that included about a dozen teams playing DI basketball but not DI football. After removing those — and about 200 other teams that don’t play football in Division I — our basketball results matched the football list, team for team. Instead of an arbitrary cutoff, I ranked the entire group of 130 teams playing both sports.
Teams on the BKM leaderboard that don’t play DI FBL: Creighton, Georgetown, Gonzaga, Green Bay, Marquette, Missouri State, Murray State, Old Dominion (<25 yrs, so ineligible for the Combo), Penn, Princeton, Providence, SFA, St. John's (NY), VCU, Villanova, Weber State, Xavier. Teams that made the Combo rankings once those seats were vacated: Michigan, Florida State, and North Carolina. How did they get there?
Using the NCAA formula (wins divided by games played where ties equal half a win), I ran win percentages to ten+ digits (four displayed below) in each sport and, with no reason to stop at 50, I ranked each of the 130 teams by:
The “rank sum” method (there’s probably a better name but I’m no statistician) used in the NCAA tweet. I lined up teams based on the sum of their combined BKM and FBL ranks. Quick, easy and, this time, more accurate.
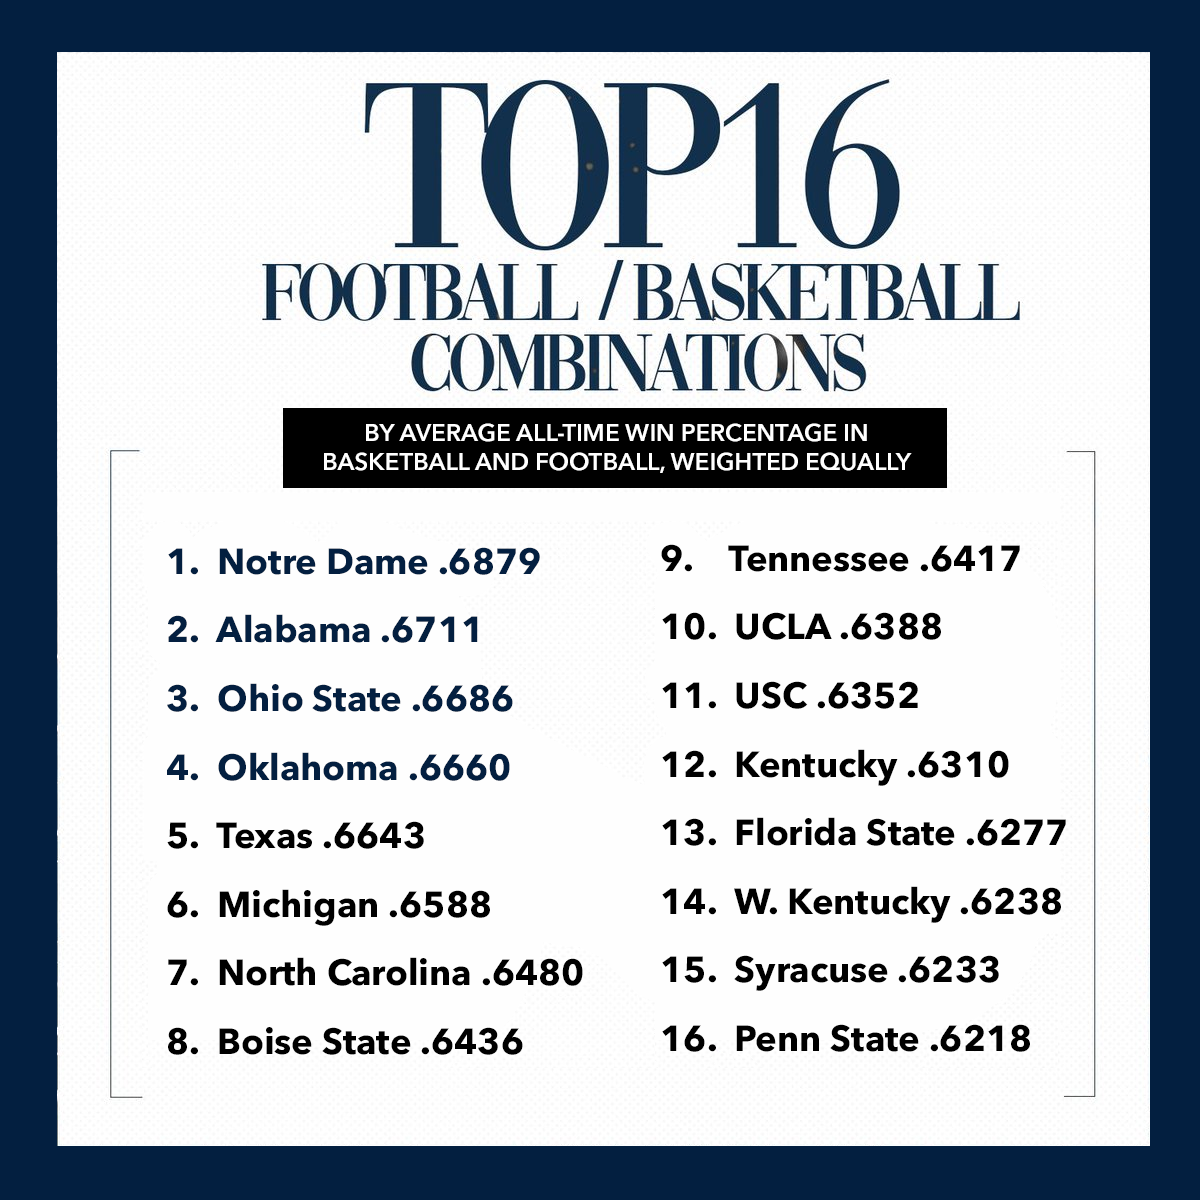
Averaging the two winning percentages of each university, giving equal weight to the two sports and ignoring the number of games played in each.
Totaling every game played on the hardwood and gridiron and calculating an overall win percentage — not a bad method if you don’t object to padding stats with basketball wins from the start of the LAST century (lookin’ at you, basketball schools).
Which ranking is most helpful or accurate is debatable. Maybe let the numbers speak for themselves now that the clutter is out of the picture.
So tweet this, a more accurate list of the top schools playing Division I basketball and football for a minimum of 25 years each:

Or, if win percentages mean more to you than rankings and you weight the two sports equally:
Or if you want to compare the overall win percentage of ALL games played, regardless of sport.

So, was this exercise ultimately a homerish attempt to put my team on top? Not really, because we’re not there — but at least I know how close we stand. However you shake it out, the author of the NCAA story was right that there were some expected results and, frankly, we all owe the Hilltoppers more respect.
Want to see the receipts?
Here’s a snapshot of my summary spreadsheet if your screen can manage it. The bigger your screen, the better.

Sorry, I know that the back room of an online store isn’t an ideal platform to review stats so if you want an even better look at all 3,120 data points, click here for a link to a Google Sheets view of the spreadsheet.